What Is a Frequency Response Curve?
To judge how faithfully earbuds or headphones reproduce the music, podcasts, or games you love, it's common practice to measure their frequency response. A frequency response curve illustrates how loudly the speakers play each frequency relative to the rest. It's usually charted as a curve, with amplitude displayed in decibels (dB) on the y-axis and frequency displayed in Hertz (Hz, or sound waves per second) on the x-axis.
Frequency Ranges
Low frequencies, between 20 and 200 Hz, are bass tones. They convey depth but can overpower a composition if they're too loud. Frequencies between 2,500 and 20,000 Hz register as treble notes, providing clarity and brilliance. If the treble is too high, music can sound overly bright, sibilant, or piercing.
Mid-range waves, between 20 and 2,000 Hz, carry some of the most fundamental sounds of musical instruments and the human singing voice. Our ears are very sensitive to these tones, making it risky to adjust their relative volume. If they're turned too high, the composition can sound unpleasantly tinny.Frequency response charts also include a reference line, usually set to zero decibels. This reference line does not represent the threshold of human hearing. Since decibels are relative, you can think of the reference line as a neutral volume level. When the response curve rises above it, those frequencies sound louder than the rest. When it curves below the line, those frequencies are relatively softer.
It sounds simple enough. But if you're not familiar with frequency response curves, they can be challenging to read. How do you know if it's a good curve or a bad one? It's a trick question, because a listener's preference, ear health, and expertise all play a role.
That said, while most of us have strong opinions about the best place to get a slice of pizza, a truly great pizzeria makes a slice that works for almost everyone. The same is true of headphones and earbuds. Most expert testers agree on the best sets, and those sets tend to have very similar frequency response curves. They are so similar that you can combine the best examples to create idealized target response curves. We've done this for both earbuds and headphones. We call them the GearLab House Curves.
Brief History of the Harman Curve
While creating a target response curve may seem like a no-brainer to judge the accuracy and quality of headphones and earbuds, we owe this idea to an innovative group of researchers at Harman International. Here's the story.
Walkmans popularized headphones in the 1980s, iPods and wired earbuds took over around the turn of the century, and modern, high-quality headphones gained traction in the late 80's. By 2012, sound engineers were trying to reproduce balanced, accurate mixes that sound like you're in the room with a band through tiny speakers placed over or in your ears.
It's a herculean challenge. At the time, headphone quality was all over the place, and many listeners were missing the polished products created by hard-working artists and sound engineers.
In 2012, Dr. Sean Olive and Todd Welti of Harman International recognized the issue and designed a double-blind experiment to compare listener feedback to the frequency response curves of six headphones. They found the models with a smooth, neutral curve sounded best. Then they used those examples to define the first-ever target curve for the industry.
That first test polled 10 trained listeners. Subsequent research has surveyed over 283 people across a range of ages and audio experience diversity from Canada, China, Germany, and the United States. Most have been Harman employees.
Harman has since expanded the number of headphones and earbuds they've tested and the number of listeners who've judged them, creating refined iterations of the Harman Curve along the way. With that many data points, the Harman Curve is considered an industry standard. It helps people judge how well a set of headphones works and helps sound engineers create accurate, high-quality options.
Knowledge Gaps
The Harman Curve isn't perfect though. In their tests, Dr. Olive found that their original target curve matched the musical tastes of 64% of users. That's a strong majority, but it may not be you.
Testing Devices
Target response curves also need to be specific to the equipment used to measure the response curve of your earbuds or headphones. We use the Brüel & Kjær Head & Torso Simulator Type 5128, or B&K 5128. The original Harman research used the GRAS 45 CA. Recently, Harman shifted to the B&K 5128, which is now standard across the industry.
The Most Recent Harman Curves
Finding the best target response curve is a moving target. While Harman started with one curve, it now has a number in development, some for around-ear (ae) headphones and others for in-ear models for example. And Harman is still working to refine them.
The Target Curve of Headphones Versus EarbudsThe original Harman Curve was developed for over and around-the-ear headphones. In a 2017 presentation, Dr. Olive shared that those target curves may not apply to in-ear headphones, i.e., earbuds. That's because around-the-ear headphones interact with the shape and acoustics of your outer ear or pinna. Earbuds do not.
Earbuds also produce unique acoustics in the ear canal and are highly dependent on a good seal, which impacts frequencies below 500 Hz. That's why it's so important to find a good fit when your earbuds come with a number of ear tip options.
In October of 2024, Dr Olive presented "A comparison of in-ear headphone target curves for the Brüel & Kjær Head & Torso Simulator Type 5128," at the Audio Engineering Society conference in New York. The study tested listener preference for five target curves for in-ear headphones created with the B&K 5128, including Harmon's earbud-specific Har2019 curve.
The study surveyed thirty-two Harman employees using three songs — “Cousin Dupree” and “Gas Lighting Abbey” by Steely Dan, and “Bird on a Wire” by Jennifer Warnes — thanks to their broad range of densely packed frequencies.
Seventy-two percent of the listeners preferred the Har2019 Curve and the SoundGuys Headphone Preference Curve equally, despite the SoundGuys curve providing less emphasis on bass and treble frequencies. Since the drop in decibels was consistent for both ranges, the paper theorizes that the two mixes remained equally pleasing despite their differences.
Twenty-eight percent of listeners preferred two other curves in equal measure — the modified diffuse-field response and Harman's above-ear headphone curve, the APHarman2018Ver2. These participants were, on average, 10 years older than those in the majority group. These curves have 2 dB less bass and 1 to 2 dB more treble than the larger group, suggesting that age plays a role in curve preferences.
All this is to say, refining the right frequency response curve for your earbuds and headphones is a moving target.
The GearLab House Curve
The question still stands — what is the best target curve for headphones and earbuds that will satisfy most listeners? We answer it by creating and updating the GearLab House Curves.
Our earbud curve emphasizes the treble and bass a bit more than our over-ear headphone curve, which is smoother with less emphasis across all frequency ranges. That's likely because headphones allow sounds to resonate more naturally across your outer ear, reducing the need for adjustments to achieve a beautifully authentic sound profile.
How We Did It
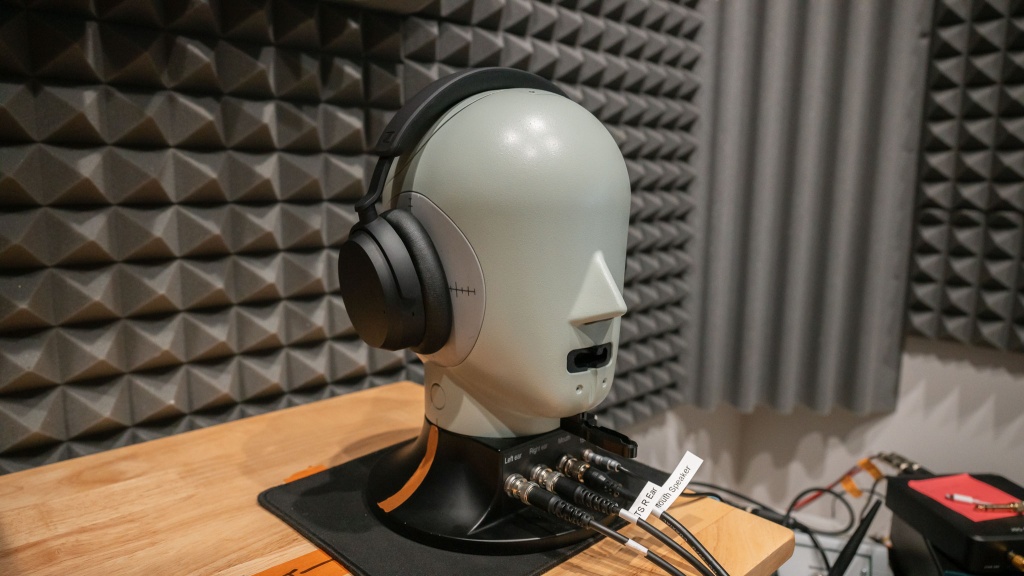
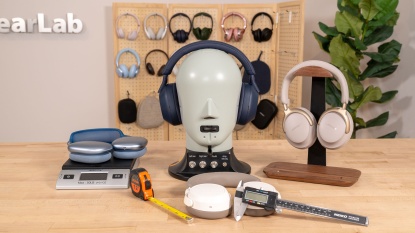
We started with dozens of earbuds and headphones, a team of expert listeners, SoundCheck software from Listen Inc, and our very own B&K 5128 High-frequency Head and Torso Simulator (HF HATS), Darwin.
Though the SoundCheck software crunches the data, Darwin is the project's charismatic face, recreating the acoustic environment of a human torso, head, and ear and capturing the results with microphones placed in each ear. A speaker in its mouth can even replicate speech.
When paired with SoundCheck, Darwin performs a range of tasks, like testing microphones and noise-cancelling features, but charting the frequency response of each earbud and headphone we test is among its most important functions.
To find the frequency response curve of each headphone and earbud we play a consistent tone (a soundwave with a consistent amplitude) across all audible frequencies. Darwin captures the resulting sound with microphones in its ears, and SoundCheck measures and charts each point where the decibels increase or decrease.
Using additive synthesis, we combined the top five response curves for each frequency range, meaning that if a pair of earbuds or headphones ranked number four in base tones but number 25 in treble, only its low frequencies factor into the target curve.
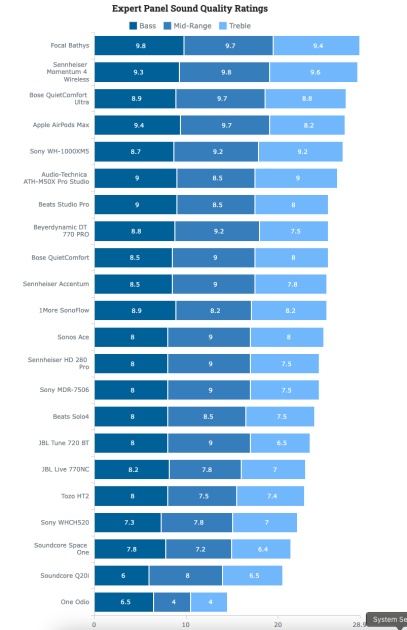
Then we double-check our findings with our own ears. Our earbud and headphone experts, Gena Bradshaw and Dave Berkman, start by critically listening to and rating each model's bass, middle, and treble response using a carefully curated playlist. Though their musical tastes differ — Berkman prefers jazz and heavy metal while Gena loves classic piano pieces and pop — both testers arrived at similar results. Our headphone testers repeated the process.
We peer-review this process and the results with several pro sound engineers from SoundInc and beyond and wait for the green light.
How the House Curve Informs Our Test Results
After creating the House Curves, we carefully compare them to the frequency response curve of each earbud and headphone to help us visualize what we're hearing.
For instance, if the treble sounds too bright, we would expect to see a spike above the House Curve in the high frequencies. A hollow or weak-sounding bass line should appear as a dip in the chart below 200 Hz. The House Curves align closely with our expert listeners' favorite pairs, giving us a great deal of confidence in our results.
Comparing the ratings and opinions of our test panel to each headphone or earbud frequency curve allows us to double-check our subjective opinions using objective data. If a frequency response curve indicates that a pair of pocket-sized earbuds is boasts wildly powerful bass frequencies, we make sure our expert listeners confirm those results.
Frequency response curves also help us steer you towards headphones or earbuds for specific tasks. If you love podcasts, for example, it's important that high bass and low-middle frequencies are neutral and not overpowered by the lower bass tones. We can see that in the response curve and have our testers verify that it works in practice. The more you learn about what you like to listen to, the more useful a target curve will be.
It's also important to keep in mind that most earbuds and headphones allow you to adjust, or equalize (EQ) the relative levels of their base, middle, and treble frequencies. (We test their factory settings.) Keep in mind though, we've never had luck making terrible earbuds sound better using these adjustments. They're best used to make a great set sound just right for you.
Our Panel of Audio Experts
Meet the team who contributed to the creation of our House Curve: Our expert audio team encompasses a range of tastes and audio expertise, from a classical music pro to a bass guitarist and DJ with an extensive music catalog to a Salt Institute-trained podcast producer.
Genaveve Bradshaw holds a bachelor's degree in music from the University of New Mexico, where she studied classical singing, music theory, and composition. Gena is a versatile musician and plays piano, guitar, and flute. She's showcased her talents in musicals, operas, songwriter showcases, plays, recitals, charity fundraisers, sports events, and variety shows. Each of these performances presents a unique acoustic challenge to accommodate the space and the crowd. Gena loves rising to the occasion.
To complement her ear training and theory background, Gena has a degree in Music from the University of New Mexico and continues to study music production and sound engineering. She's a regular Sound Gym.
Dave Berkman is the owner and head DJ at Ascent Productions, as well as a bass guitarist. Berkman pushed every pair of earbuds he tested to their vibrational breaking point to test the limits of their bass resonance.
Lead researcher Graham Faulknor holds a master's degree in mechanical engineering from the University of Colorado, Boulder. In his 15-year engineering career, he designed, built, and tested a wide array of devices, from satellites to medical devices to race cars. He's now putting his considerable powers behind our sound team's test development and analysis.
Lead writer, Clark Tate is a senior review editor who honed her ear and audio production skills at the Salt Institute for Documentary Studies. She also works as a podcast producer and has reviewed a wide range of tech products for GearLab since 2017, including voice recorders.
Conclusion
Producers and sound engineers go to great lengths to mix and master music, games, and podcasts in the studio. It would be a shame for us to miss out on their vision just because our headphones or earbuds don't faithfully reproduce the magic.
While industry standards are improving, there are real challenges to transporting a soaring symphony through two tiny speakers strapped over or into your ears. We've worked hard to create ideal House Curves and testing processes that pair subjective tastes with objective analysis. And it's all for you. We hope our hard work helps you find the perfect headset for your needs.


